

Time left05:00
Analytical ReasoningMSQ · pick all that apply+3 / −0.19
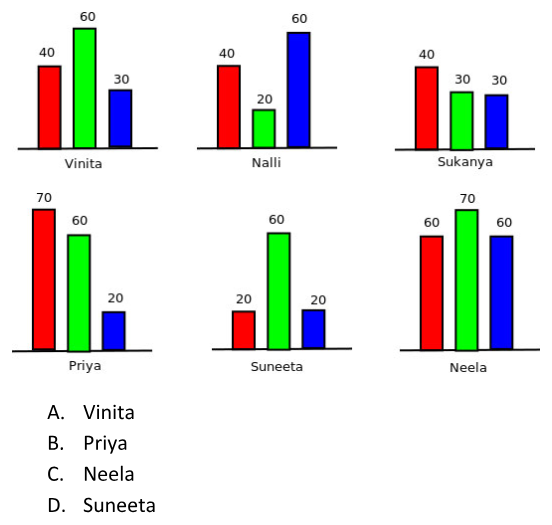
The figure given below shows six bar charts corresponding to the volume of agricultural produce from farms of various farmers. The actual quantities are also shown in the figure. Red bars indicate tomatoes, green bars indicate leafy vegetables, and blue bars indicate berries. Assume that they have seen each other’s bar charts. Who can correctly make at least one of the following statements? (i) Everyone who produced any one item more than what I produced, she also produced every other item more. (ii) Everyone who produced one item less than what I produced, she also produced at least one other item less.
Log in to save your progress.