Question 35 of 56
UCEED 2024 · Part A · Q36
Running
Type minutes : seconds, then press Enter — or use − / +.
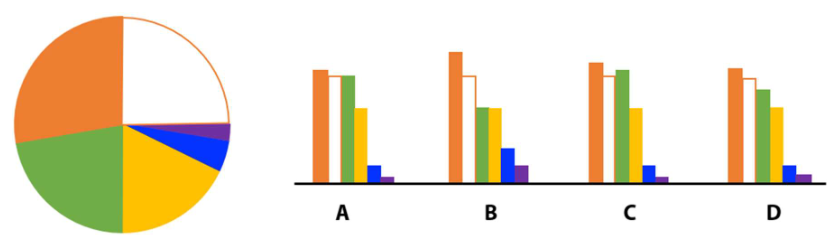
Which option represents the data in the pie-chart?
Log in to save your progress.
UCEED 2024 · 56 questions
NAT · type a number14
MSQ · pick all that apply15
MCQ · one answer27
Green correct · red wrong · dark current

 Log in / Sign up